Editor’s note: The author of this report, Cody Ostenson, is Chief of External Affairs at Denver Families for Public Schools, which is one of Boardhawk’s funders. Data analysis was conducted for Denver Families by contractor Maya Lagana.
Every student in Denver deserves access to a quality public school of their choice. Over the last few weeks, the release of 2025-2026 state testing data gives us the latest glimpse into the question that should be at the forefront of every conversation: How are students doing?
Students have unlimited potential. State test data provides valuable insight into how well schools and support systems are helping students realize that potential. The school board and district leaders must hold themselves accountable to academic results as their primary measurement of success. While schools are asked to do much more than teaching and learning, they are the sole public institution responsible for educating all students. For Denver Public Schools, that means honest and hard conversations about what the data tells us.
The top lines below come from an independent, third-party analysis of 2025-2026 outcomes below comes from publicly available data from (1) the Colorado Measures of Academic Success (CMAS) exam administered to grades 3-8 in literacy and math, (2) the P/SAT administered to grades 9-11 in literacy and math, and (3) the Colorado School Performance Framework.
You can read the full analysis here.
1) & 2) Academic Proficiency and Subgroup Proficiency
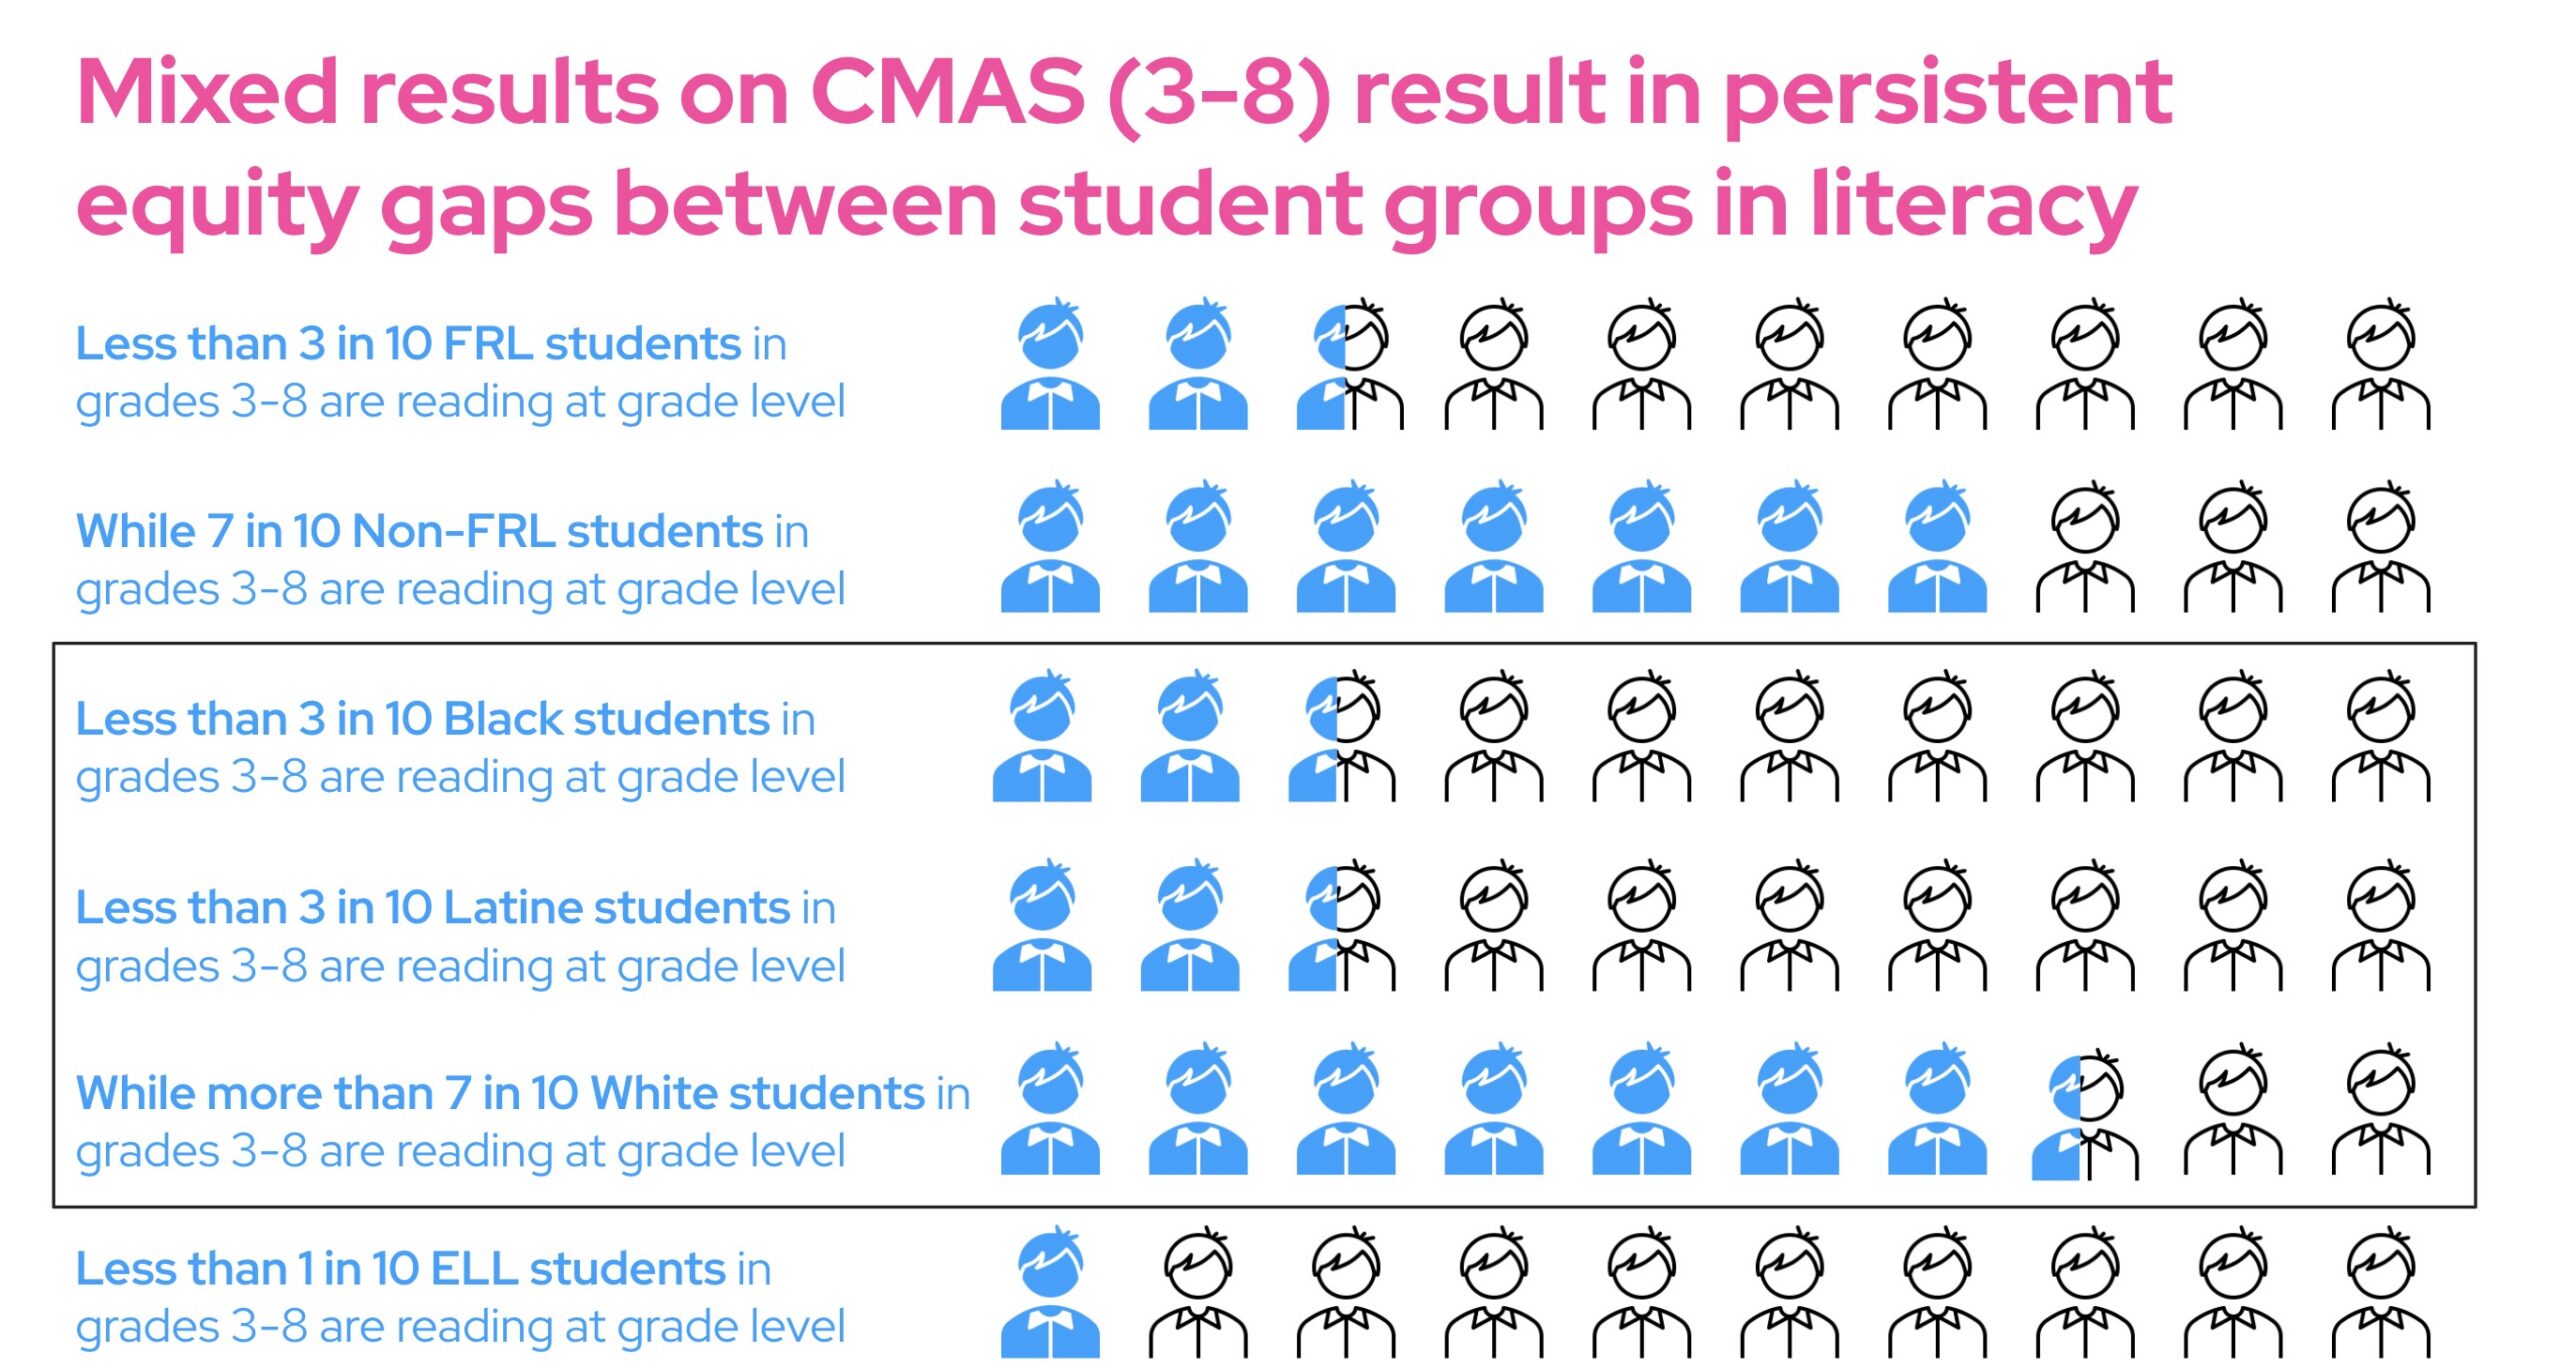
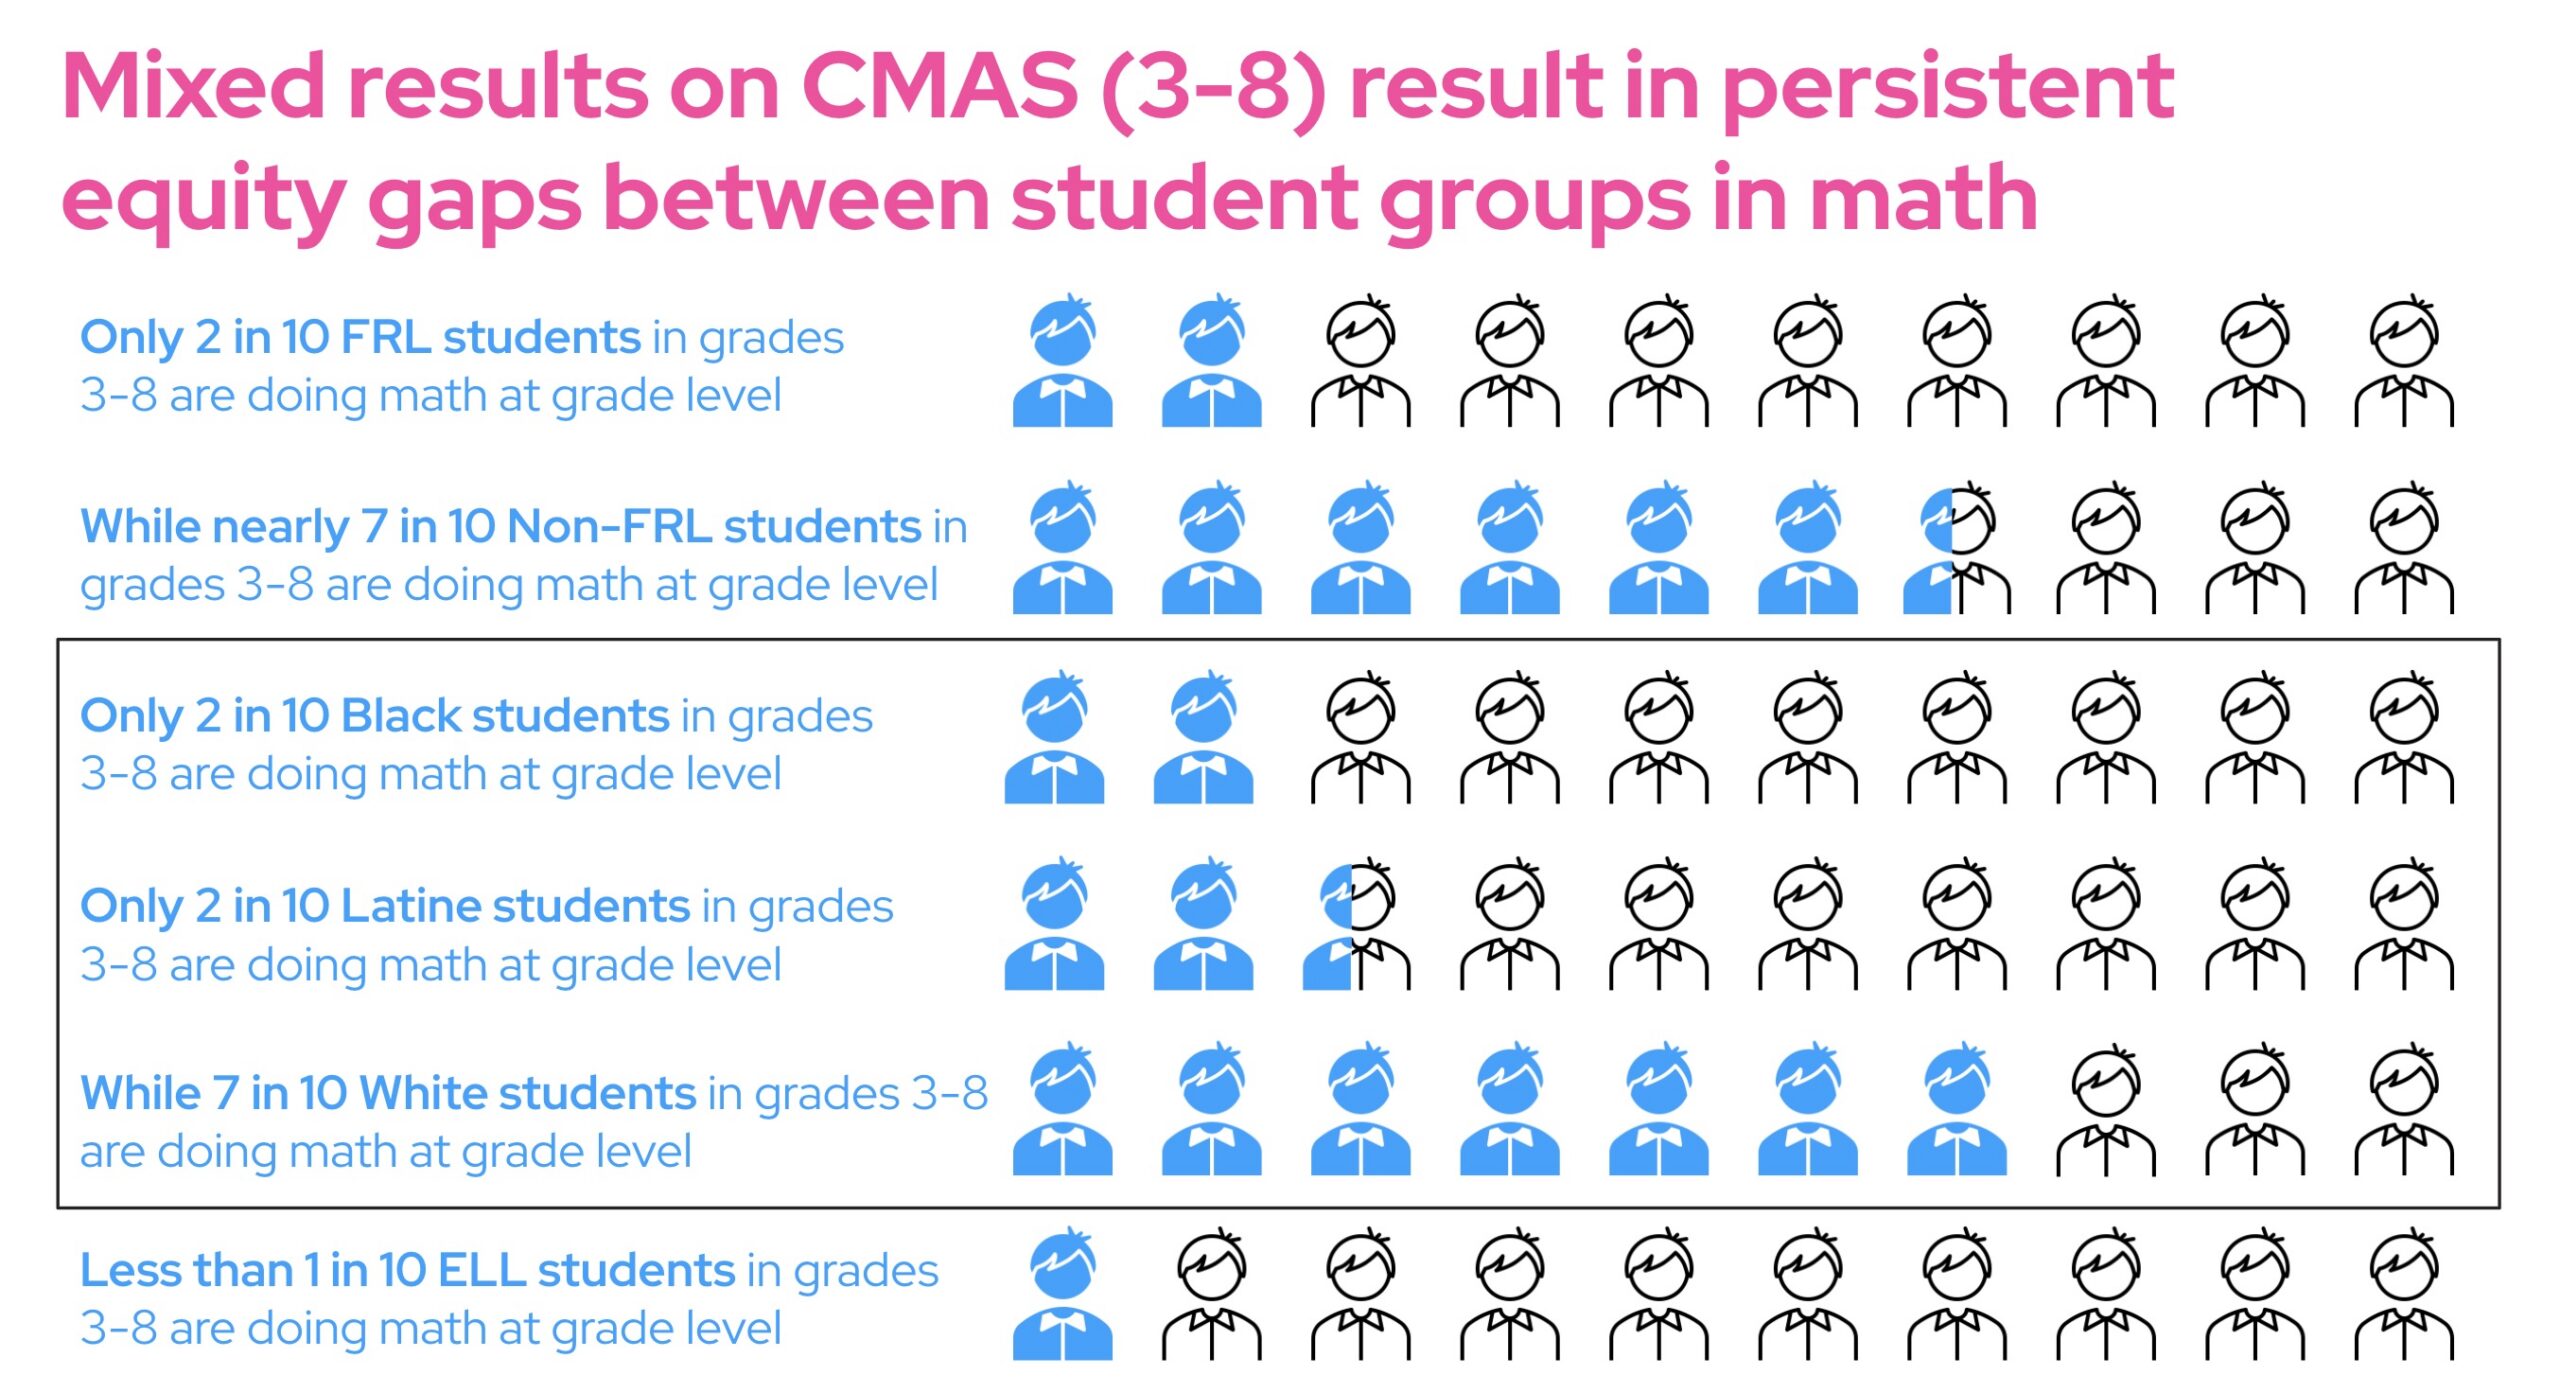
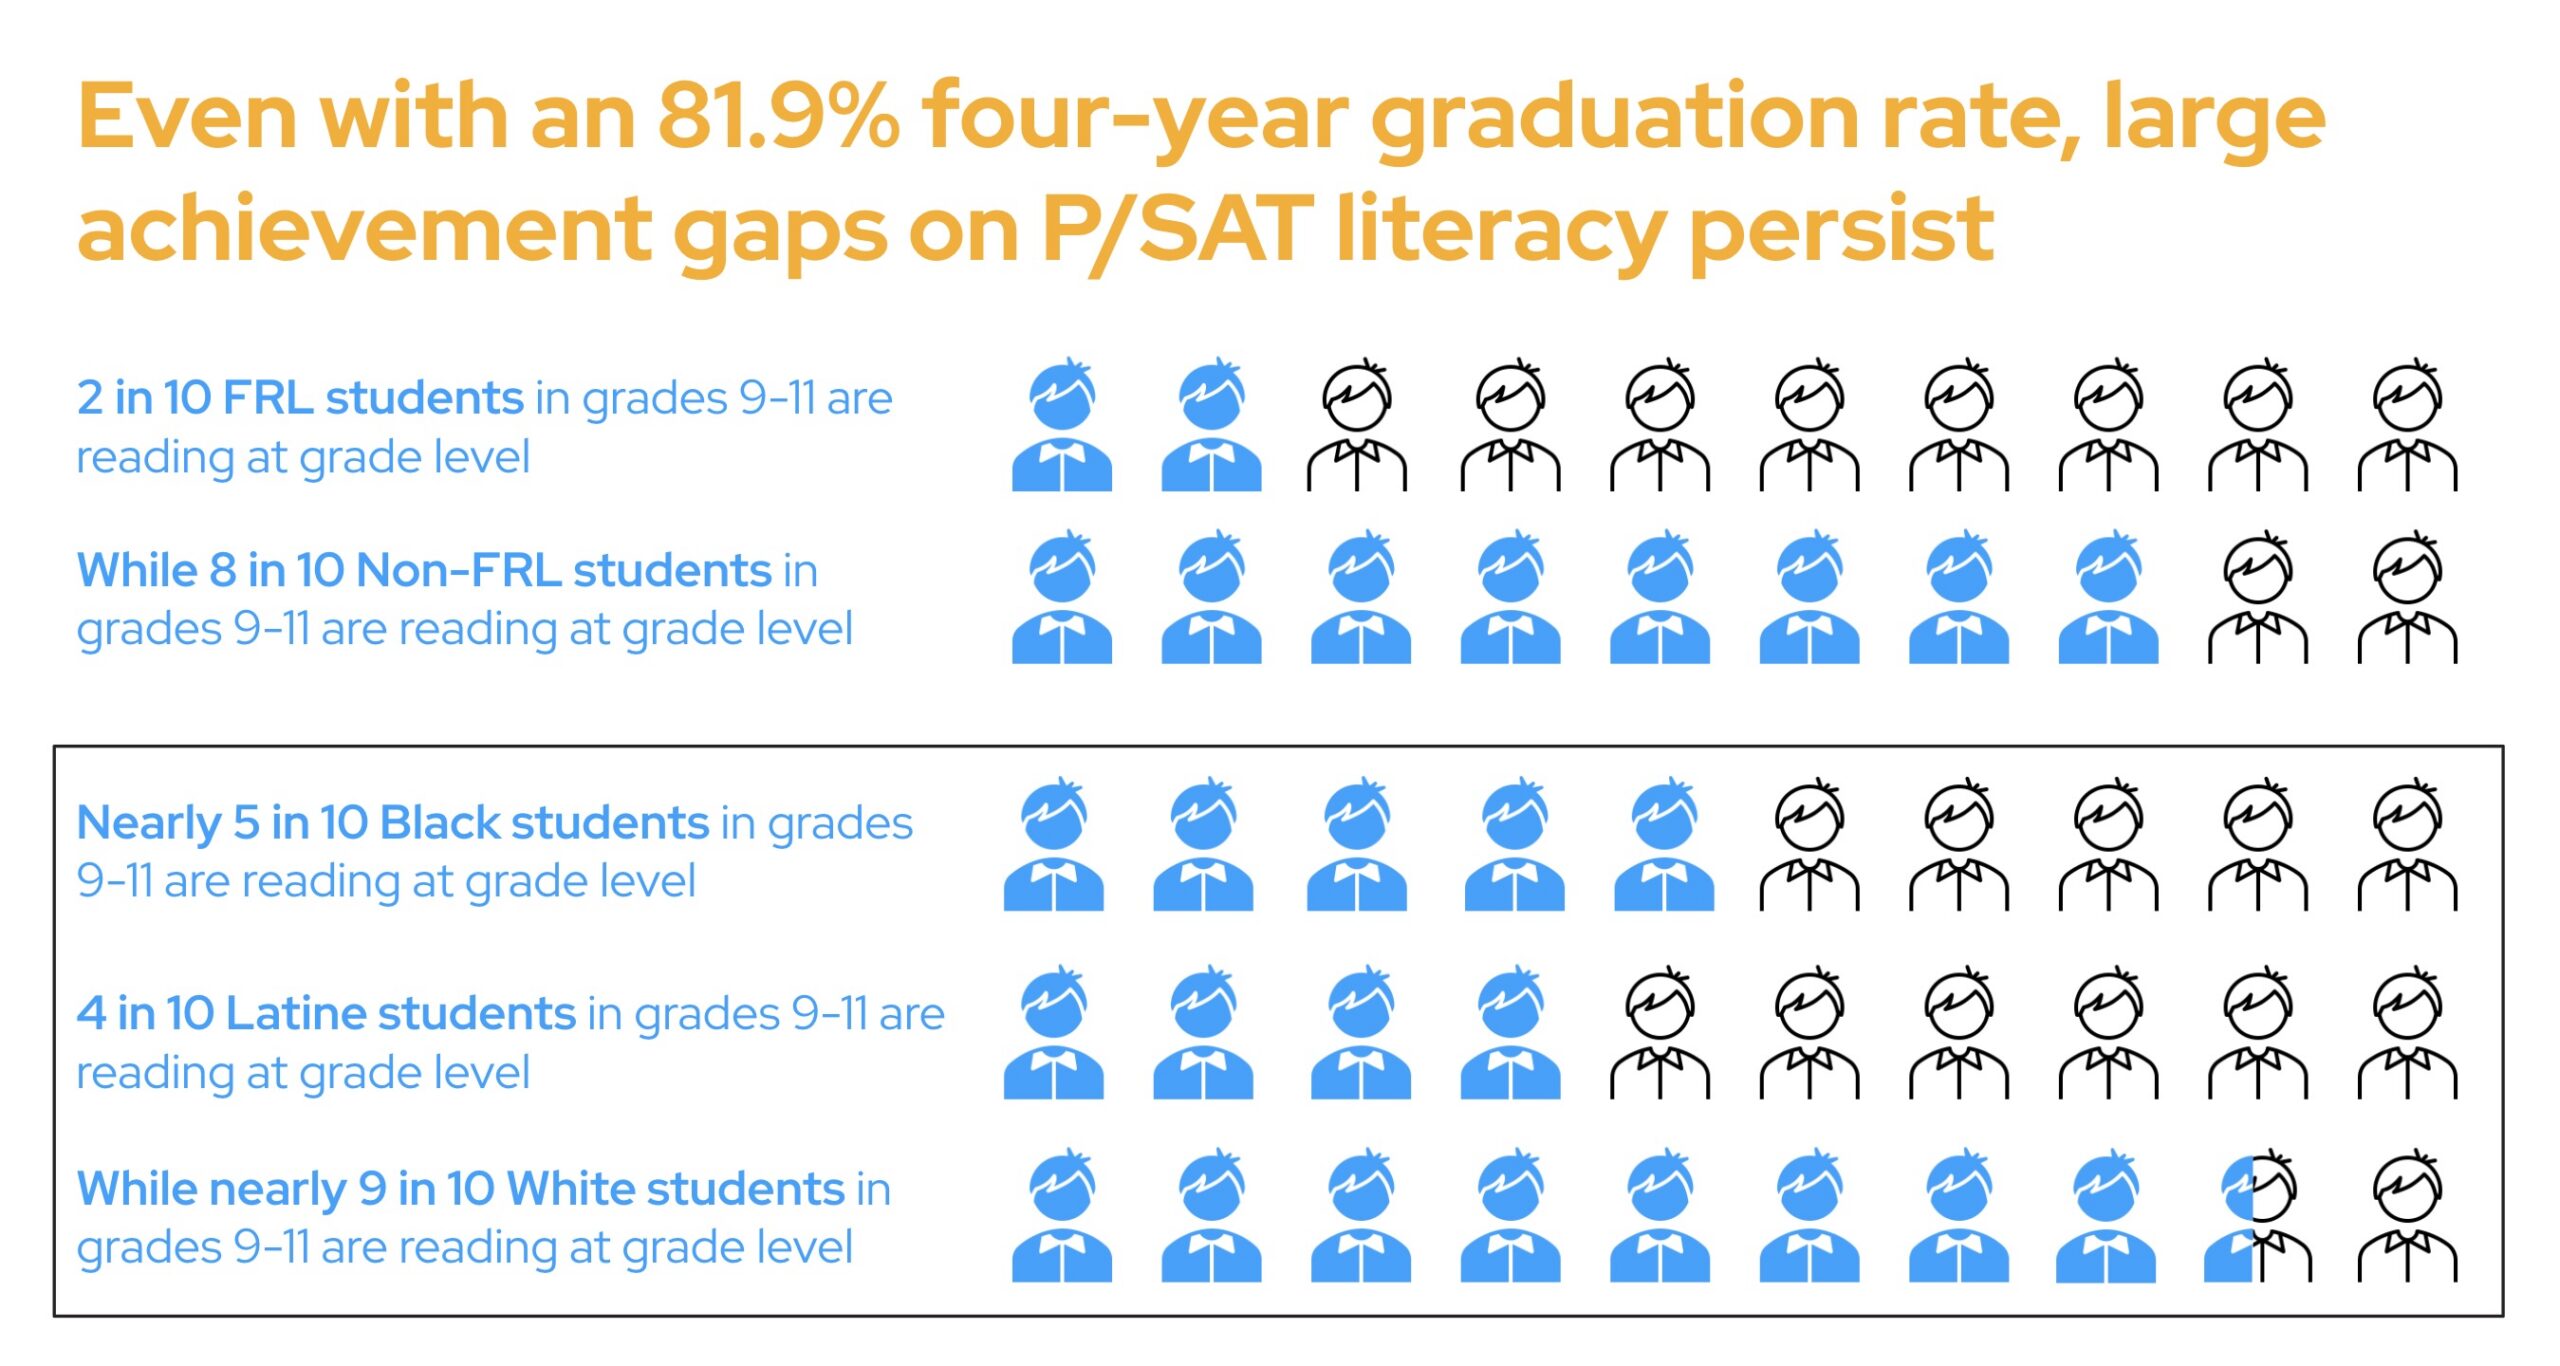
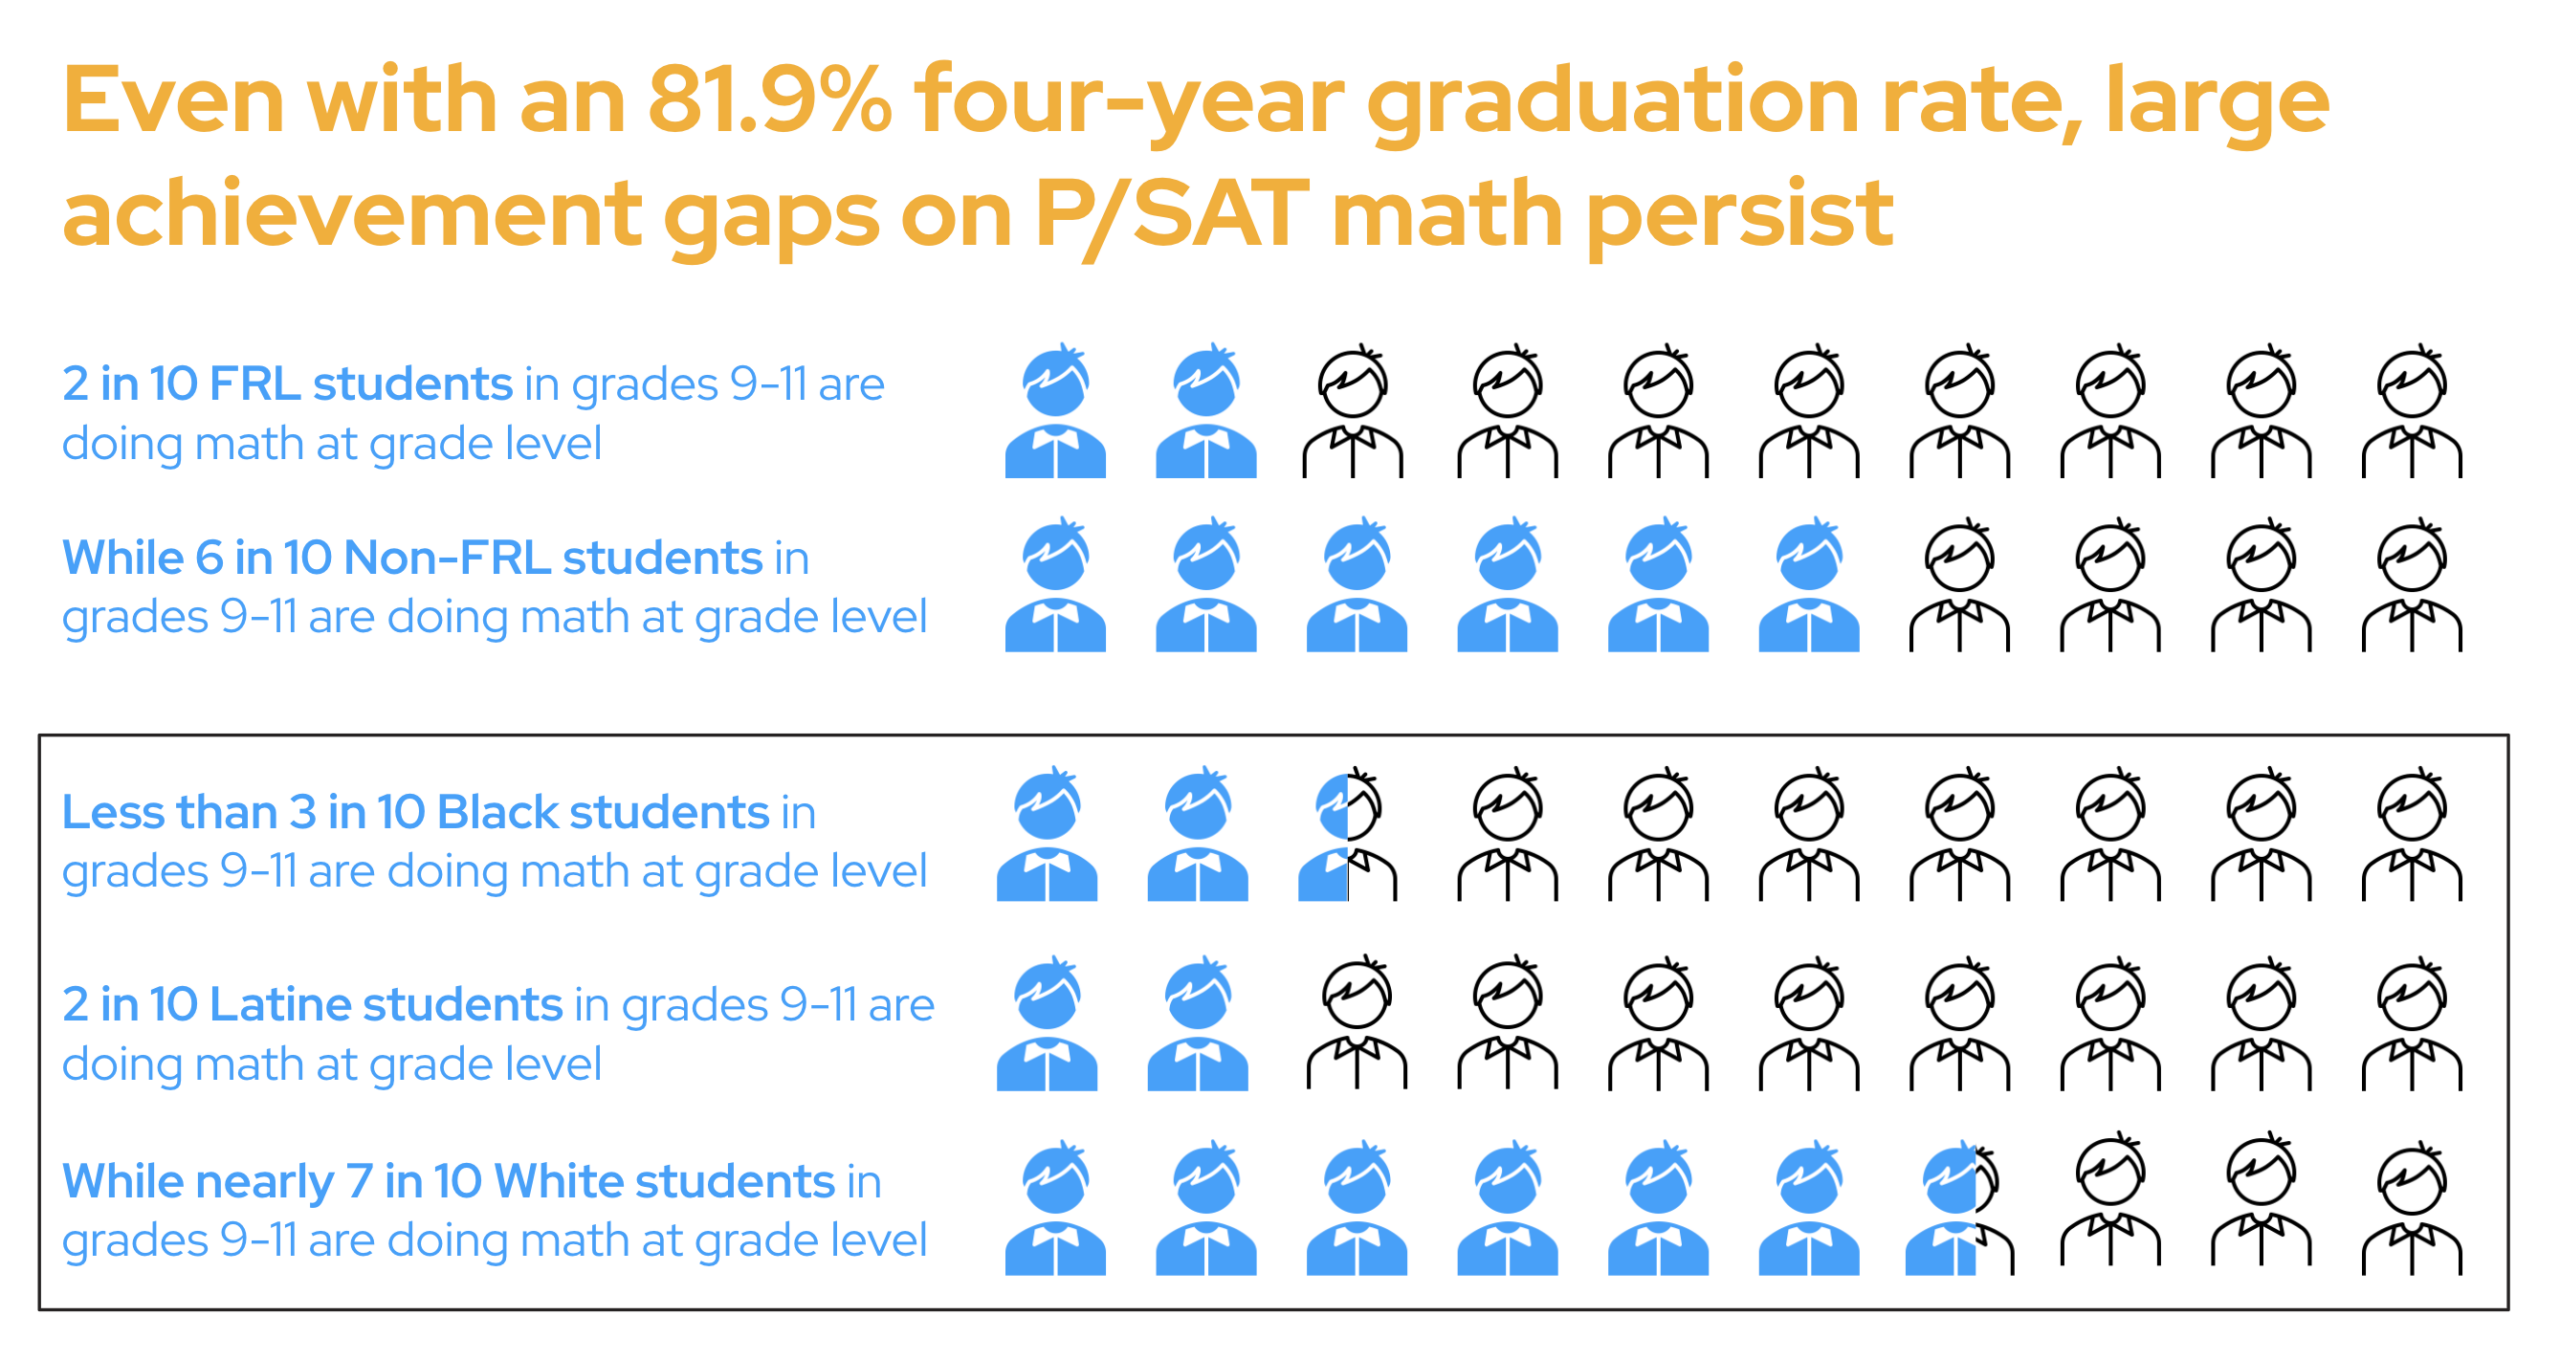
Despite incremental improvements, academic proficiency remains a challenge. Large equity gaps remain based on race, ethnicity, income, and status as an English Language Learner.
- In grades 3-8, only 4 in 10 students are proficient in reading and 3 in 10 are proficient in math.
- In grades 9-10, only 5 in 10 students are proficient in reading and 4 in 10 are proficient in math.
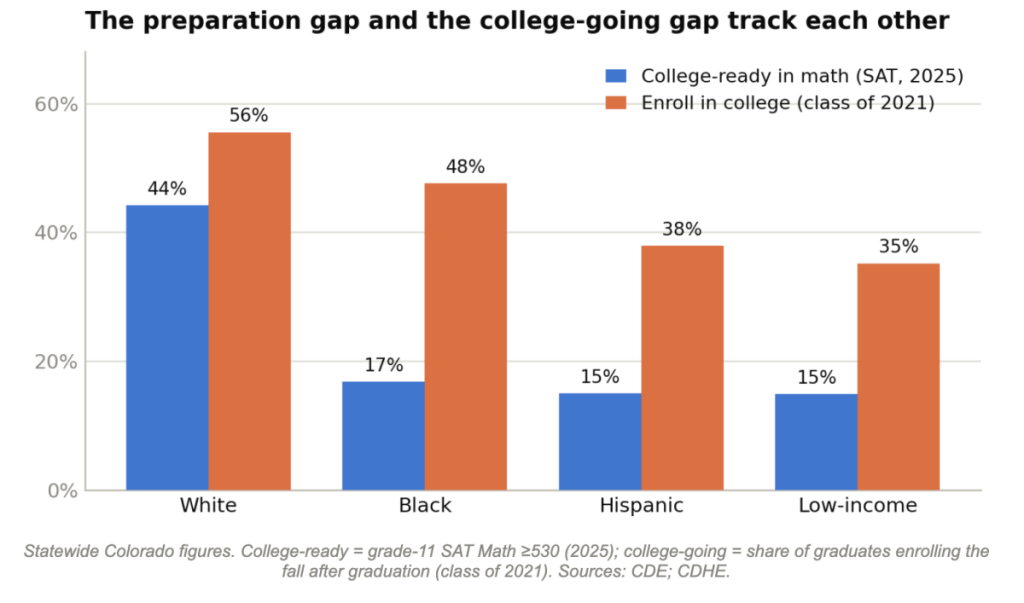
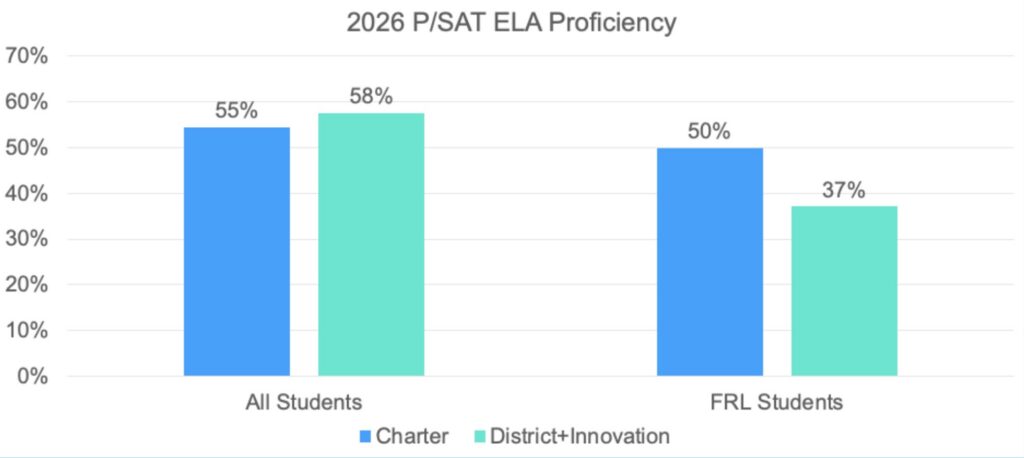
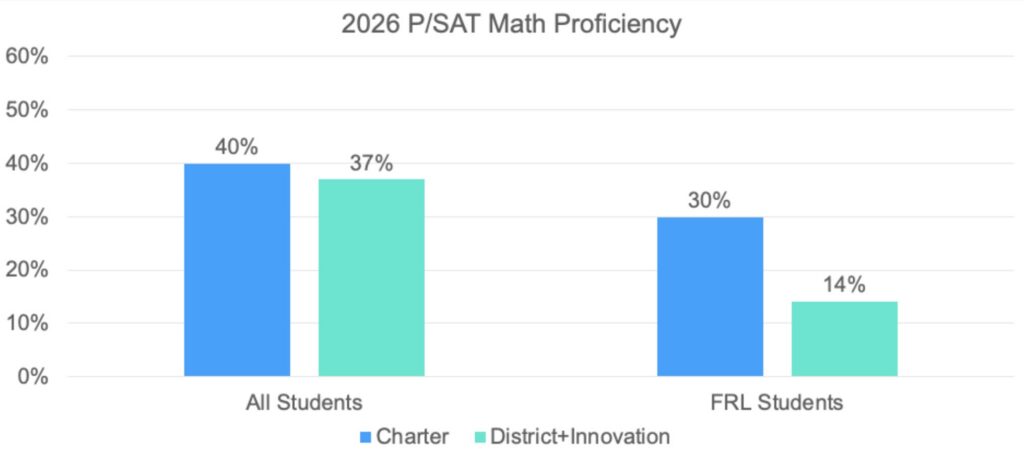
- In both results for grades 3-8 and 9-11, equity gaps of over 40 percentage points persist on the basis of race/ethnicity and income in both subjects.
- In grades 3-8, proficiency for English Language Learners (ELL) remains below 1 in 10.
3) Academic Growth
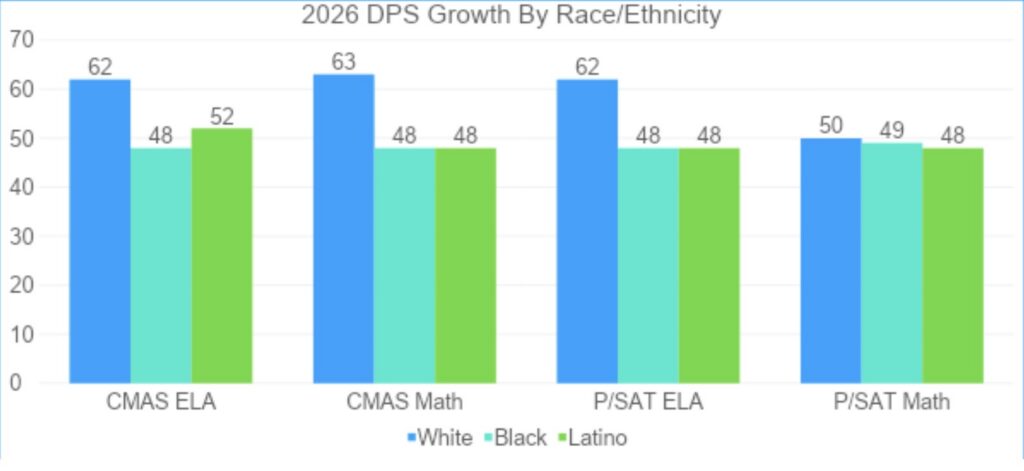
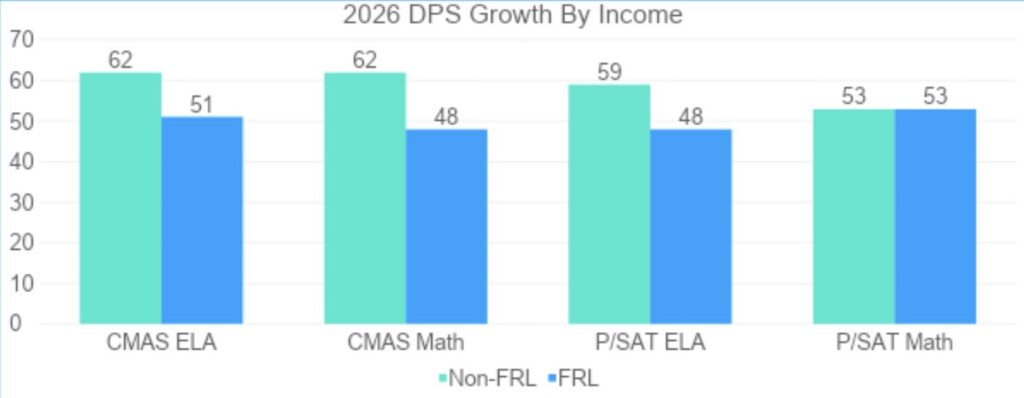
Median Growth Percentile (MGP) looks at how much growth a student makes on state assessments compared to other students who performed similarly in prior years. You can’t close gaps without above average, accelerated growth.
- A score of 50 is average growth, indicating that students are making the same amount of progress as their peers and gaps will remain the same.
- Below 50 indicates that students are making less growth than their peers, potentially widening gaps.
- The MGP needed to substantially increase proficiency varies based on a number of factors, but 65 is likely the bar to make progress significant enough to close gaps.
When analyzing disaggregated MGP data by race and income, historically underserved students continue to see slower growth than their DPS peers, risking wider achievement gaps.
4) Performance by School Type
Denver offers different public school types to students and families: public charter, innovation zone, district innovation (hereafter innovation), and traditional schools (hereafter district-managed).
By analyzing proficiency and growth scores for schools of different governance types, we can better understand how different school types are making advances in closing persistent gaps for historically underserved students.
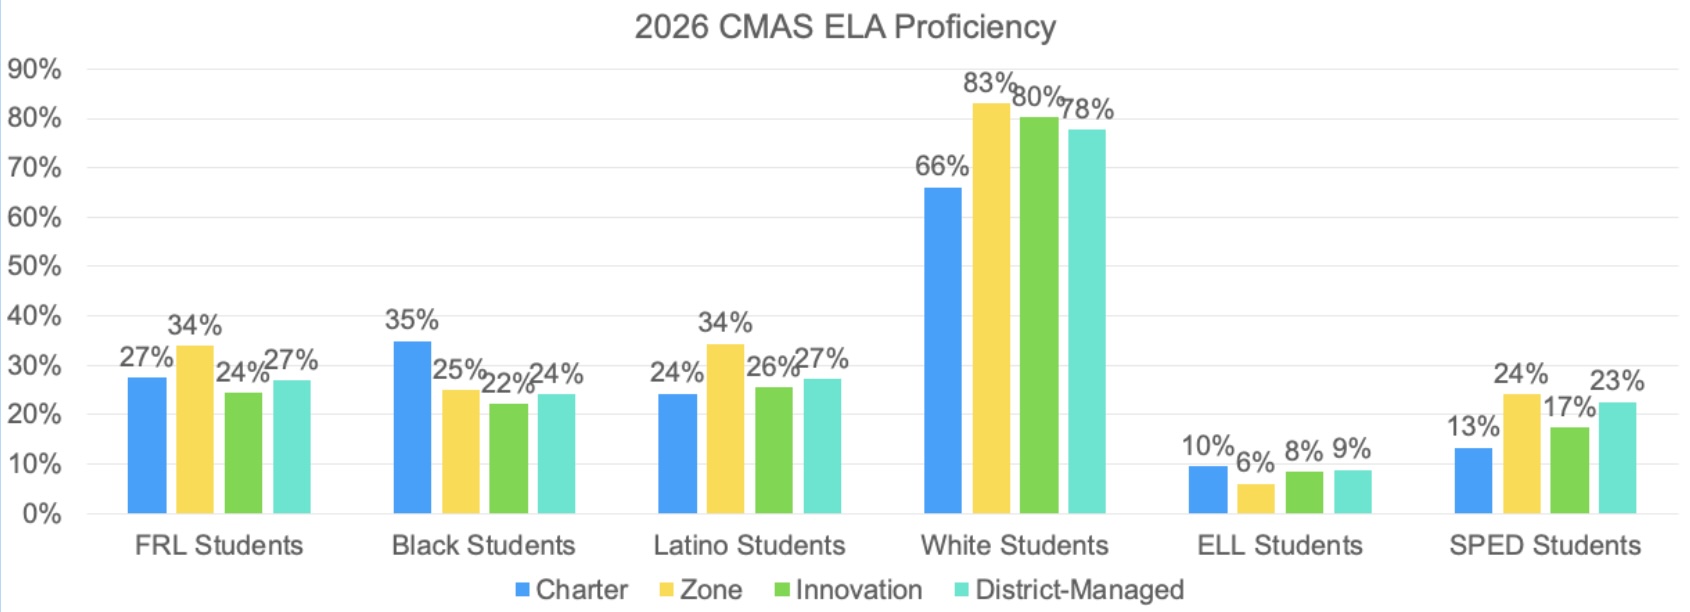
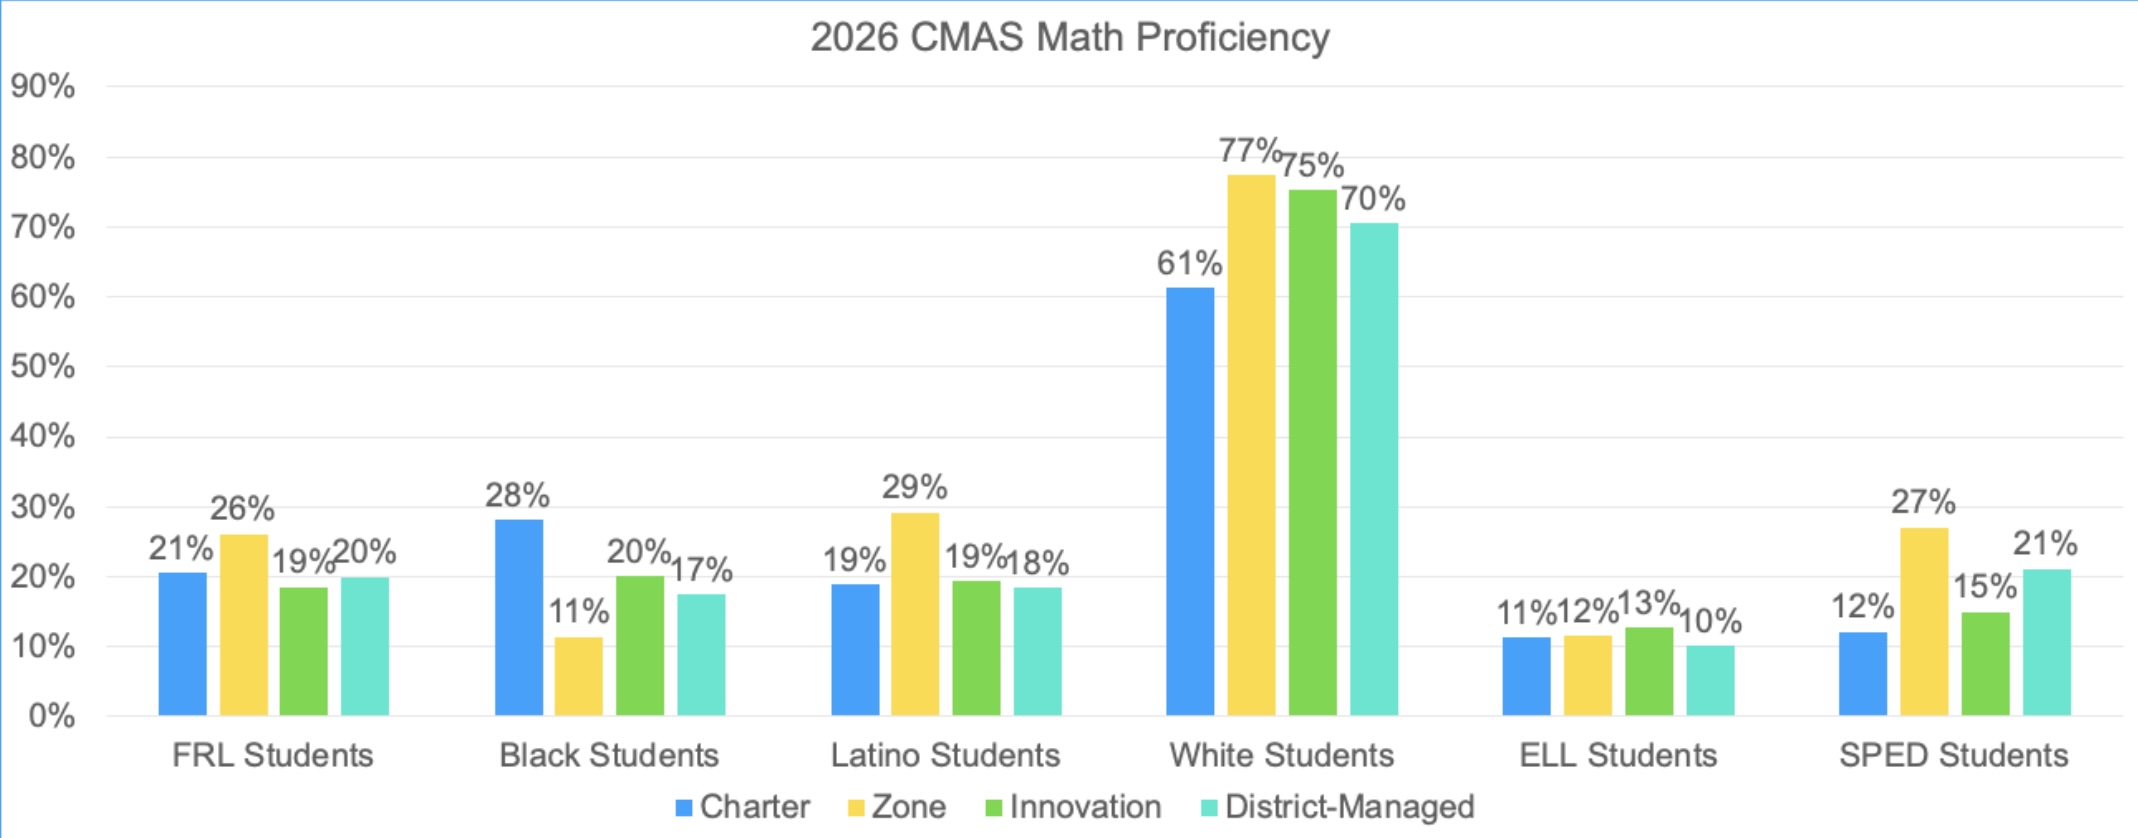
The data is clear: public charter schools and innovation zone schools see better outcomes for historically underserved students.
- When looking at proficiency in grades 3-8, public charters lead in supporting Black students, charters and zones outperform for FRL students, and zones yield the strongest results for Latino students.
- In grades 9-11, charters have significantly higher proficiency rates for FRL students.
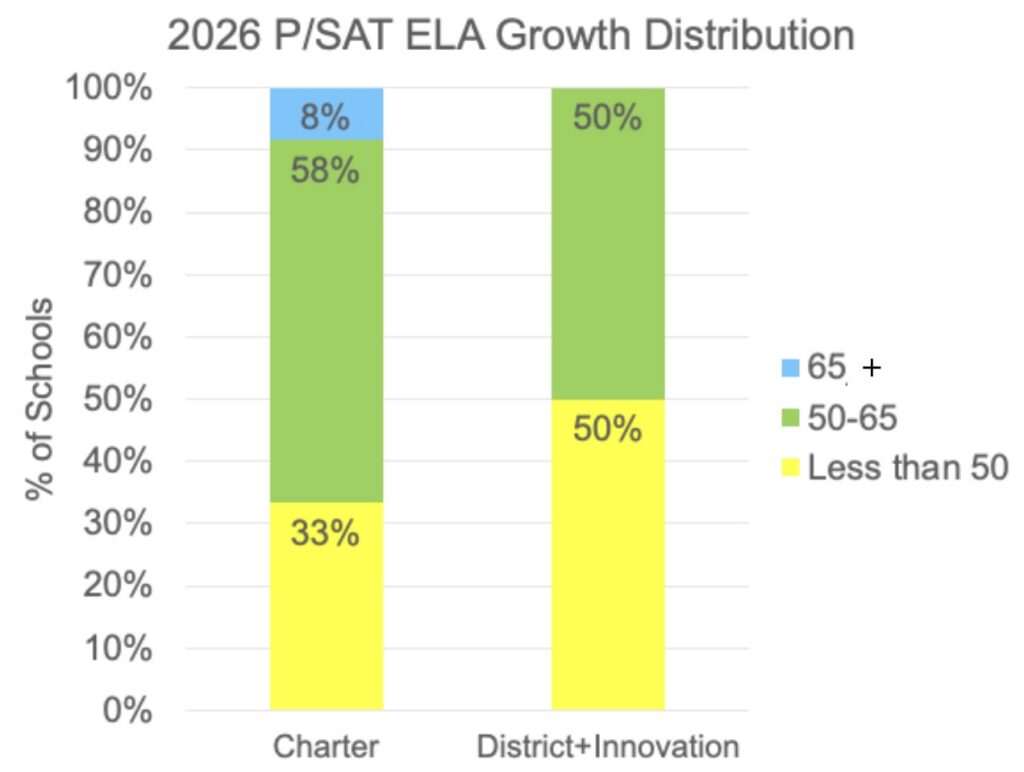
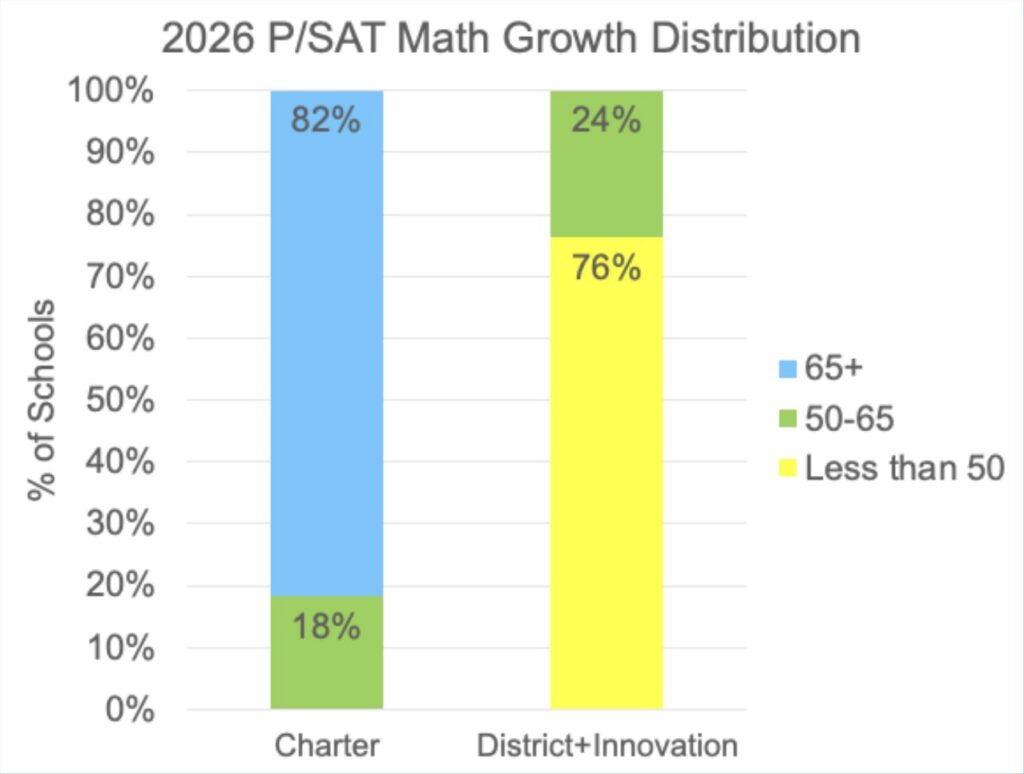
- Charter high schools saw stronger growth results for P/SAT literacy and significantly stronger growth results for P/SAT math with 82% of charter high schools achieving accelerated growth (MGP of 65 or higher).
5) School Performance Framework (SPF) Ratings
The Colorado Department of Education issues an annual District and School Performance Framework rating to all districts and schools across the state. This framework is used as an indicator of school quality and is a key component of how the state holds districts and schools accountable.
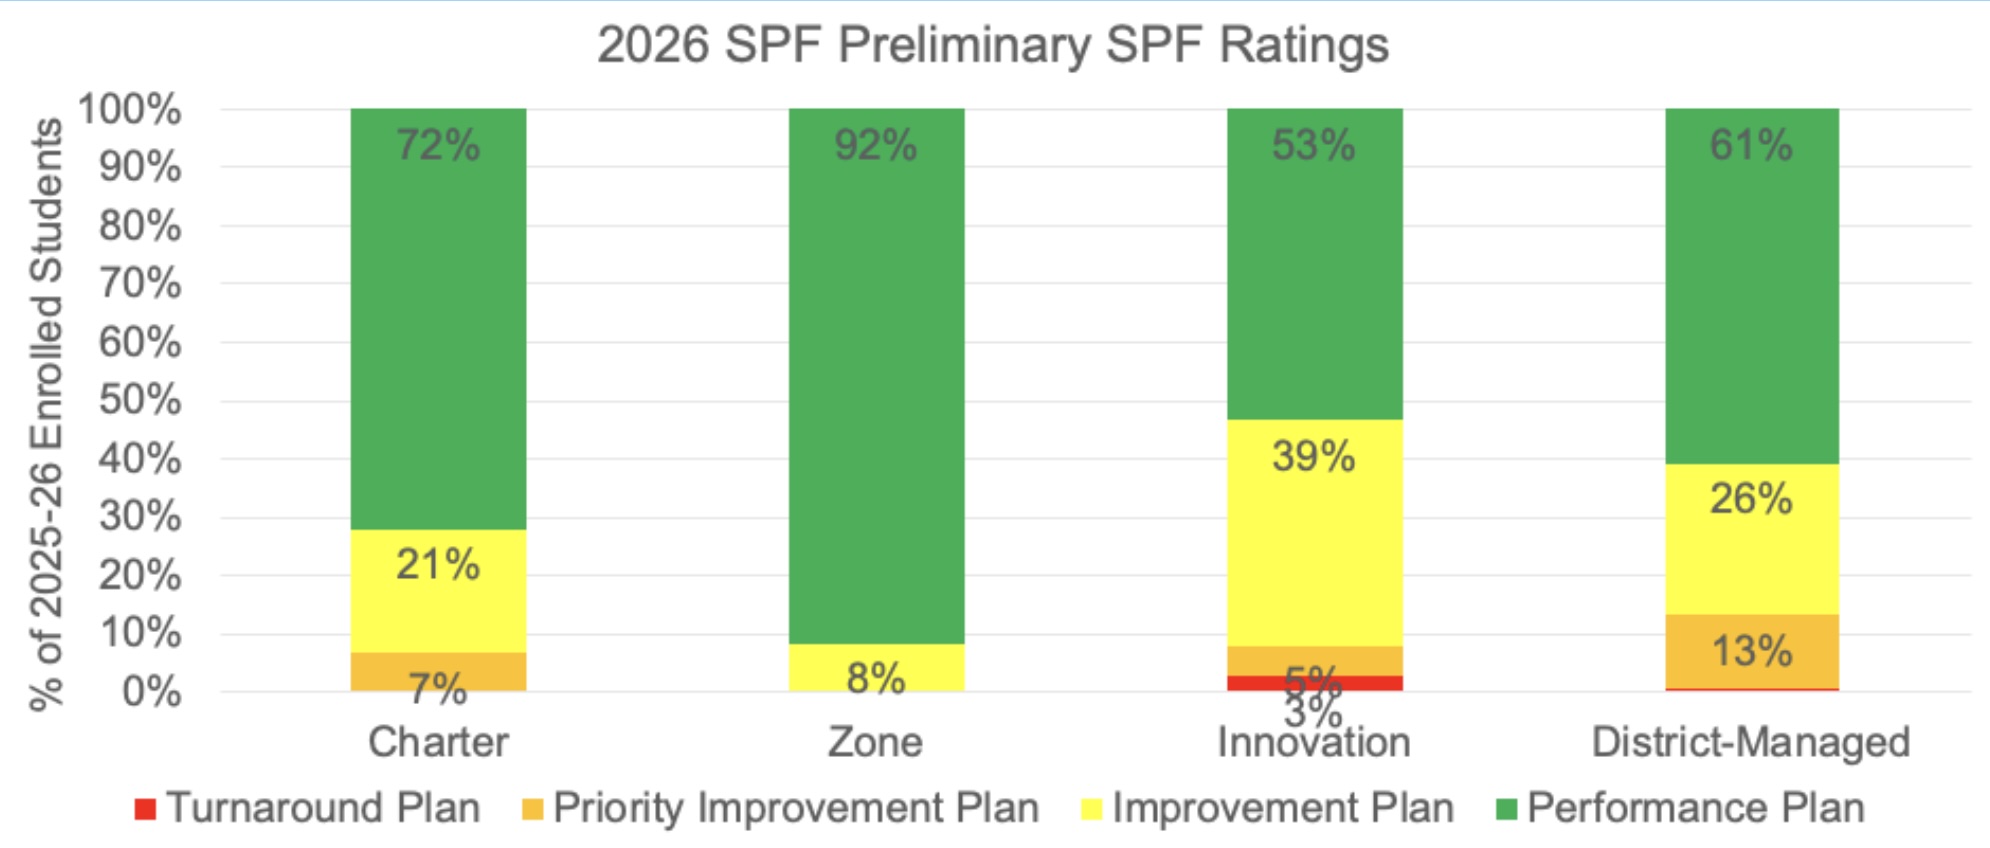
When looking at the percent of students enrolled in Performance Rated (“Green”) schools for each school type:
- 92% of students in innovation zone schools are in Green schools;
- 72% of students in public charter schools are in Green schools;
- 61% of students in district-managed (traditional) schools are in Green schools; and
- 53% of students in innovation schools (also district-managed) are in Green schools.
Therefore, public charter and zone students are more likely to be in performance rated schools (“Green”).
6) Looking Back: Assessing the 2022 to 2025 Strategic Roadmap
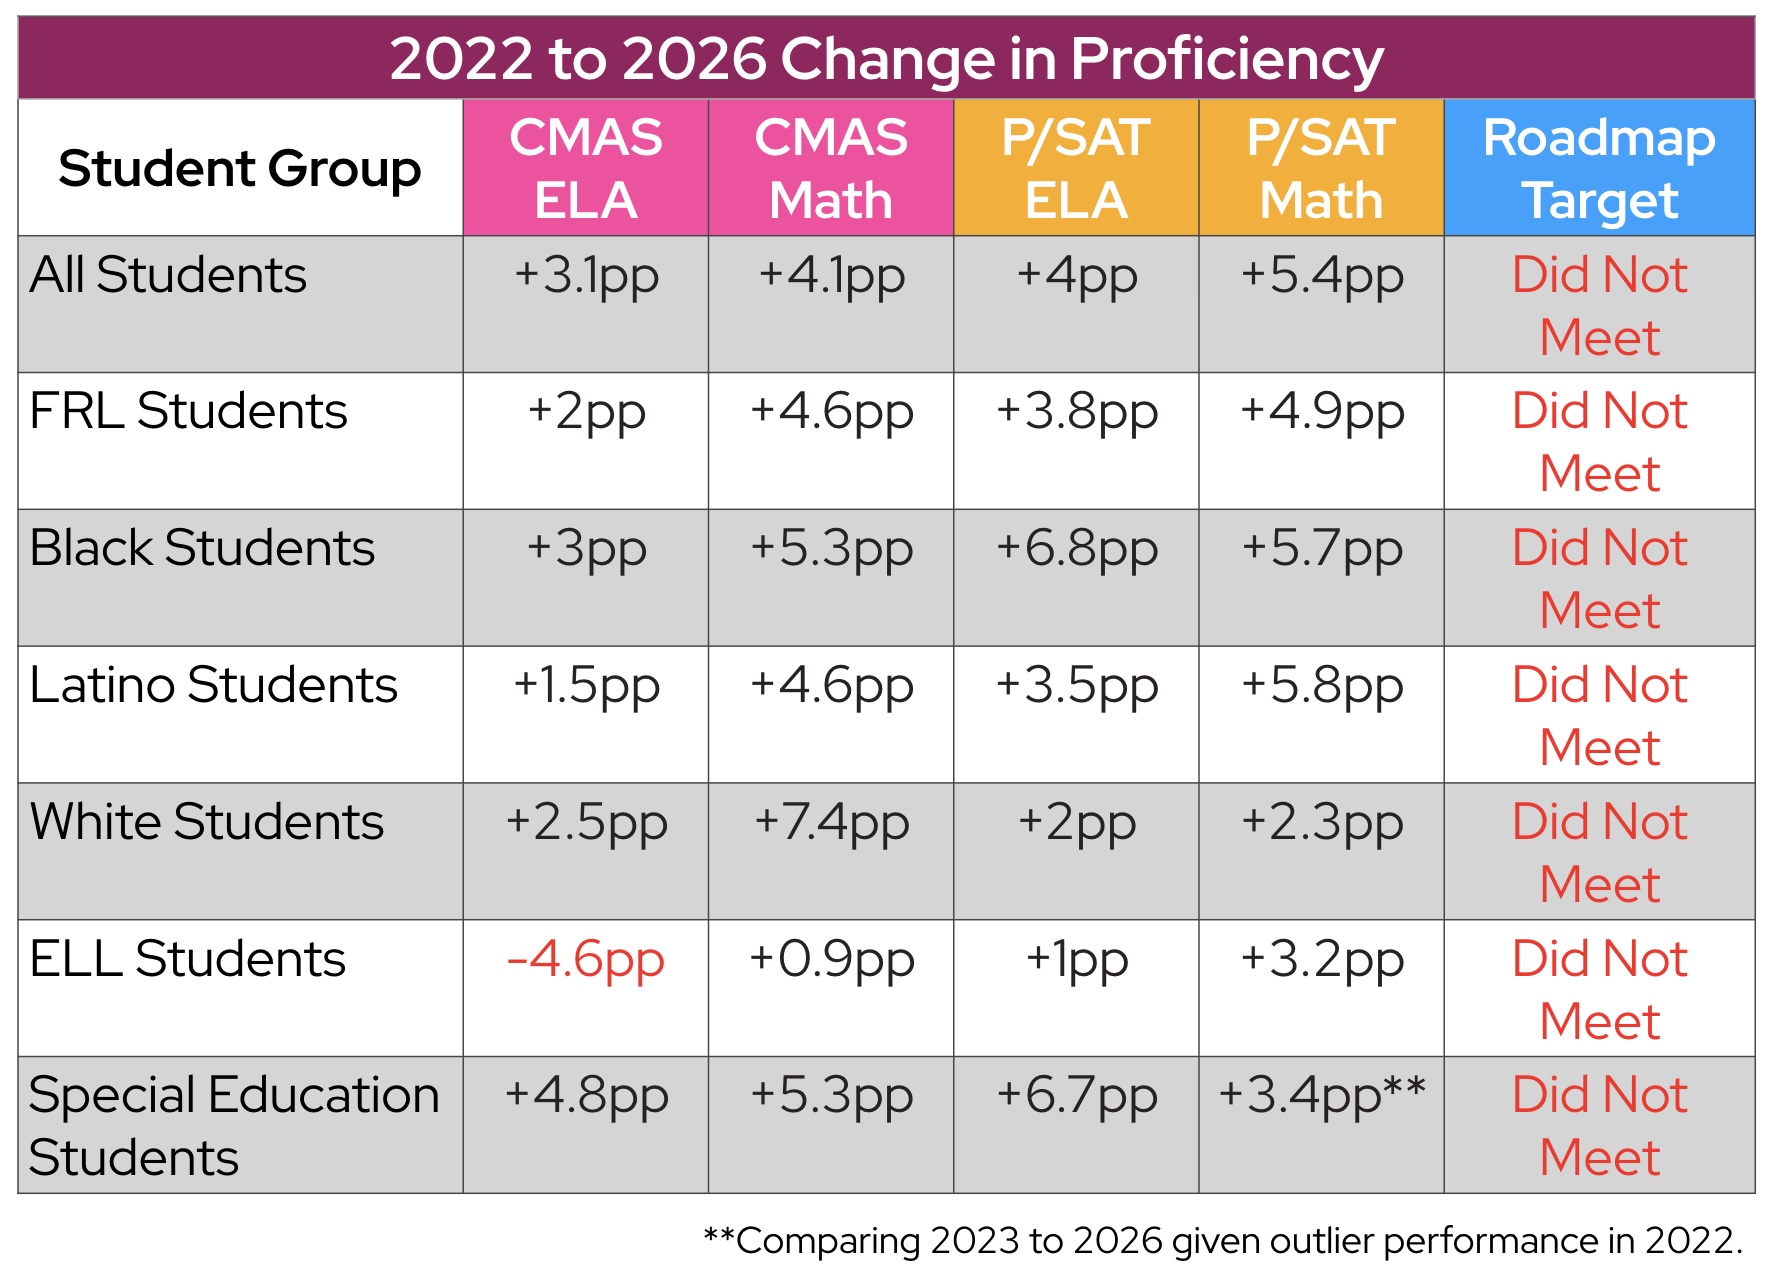
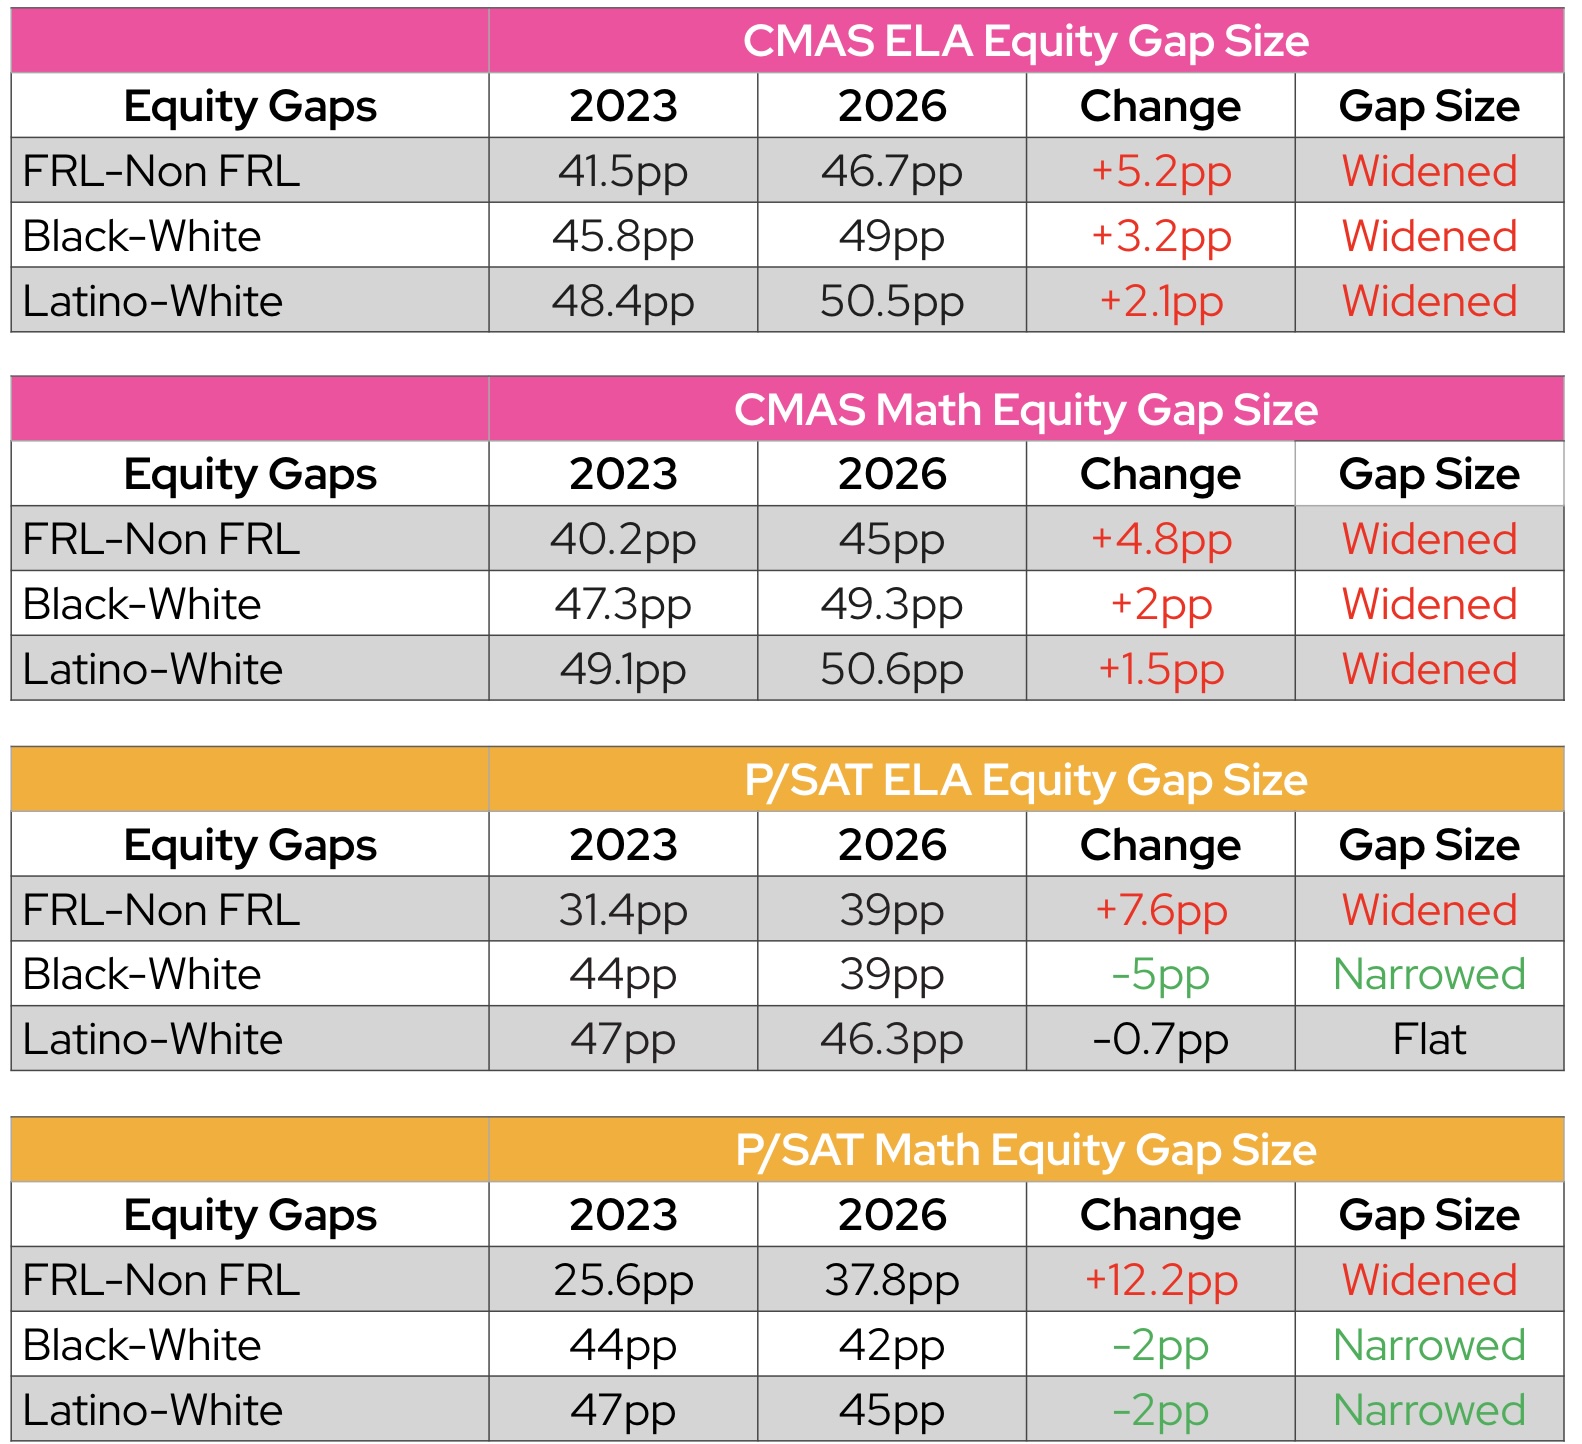
At the conclusion of the 2025-2026 school year, DPS arrived at the end of its latest strategic plan known as the DPS Strategic Roadmap. In the plan, DPS set targets to improve grade-level achievement by 10 percentage points (pp) over the five-year plan (2022 – 2026). While DPS saw increases in proficiency rates, already significant gaps between most student groups widened.
So what? Where do we go from here?
Strategic Planning
DPS is working now to finalize its next strategic plan. This strategic plan must include ambitious achievement targets, clearly aligned and articulated strategics and tactics, and a vision for how schools driving strong results like public charter school and innovation zone models are included to ensure all students have access to a quality public school of their choice.
Changing Demographics, or Increasing Performance?
In the 2026 Strategic Regional Analysis, the district’s annual evaluation of enrollment trends and related data, DPS predicts significant ongoing declining enrollment. Alongside declining birth rates and the increasing cost of living in Denver, the demographic makeup of DPS is also shifting.
“While ninth graders identify as 56% Hispanic/Latiné and 68% FRL, these figures drop to 49% and 63%, respectively, among the kindergarten cohort. Conversely, the white student population is significantly larger at kindergarten (28%) than ninth grade (20%).”
Knowing that white students and non-FRL students have historically been supported to higher levels of proficiency than their peers, and observing incremental increases in achievement and widening achievement gaps over that same period, we must untangle the relationship between what growth is expected because of changing demographics versus what growth is created because of changing policy and practice.
The Importance of Data Transparency
We also need a place where the community has consistent access to this data, and a school board and superintendent that take a more rigorous year-round approach to progress monitoring, not just when data is released once a year.
Affirming ALL Public Schools
Finally, we must put aside adult politics and affirm the role of public charter schools and innovation zone schools in the family of schools. These public schools are creating the conditions for historically underserved students to be supported towards accelerated growth and proficiency.